If you enjoyed this book considering buying a copy
- Buy a copy of the book on Lean Pub
- Buy a copy of the book on Kindle
- Buy a hard copy of the book on Amazon
- Buy the bundle Master Python on Lean Pub
Chapter 5: Reporting #
Noah
There are many reasons why testing is essential, but fundamentally testing is a crucial component to automation. Testing ensures that automation can occur. The two elements are intertwined. At the intersection is the build server.
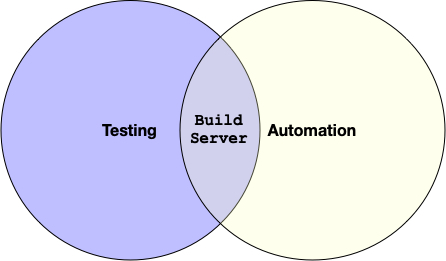
The build server performs many actions beyond just testing code.
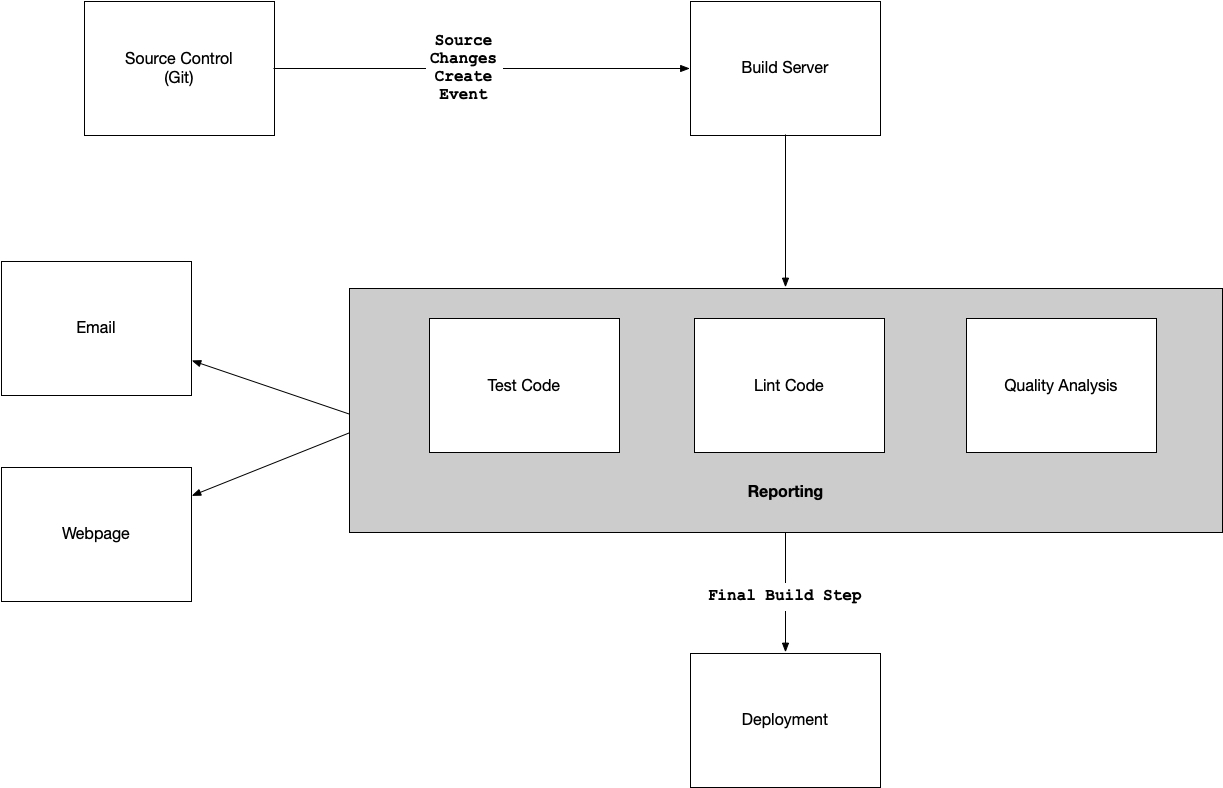
In the figure shown, the build server is doing many things. The build server tests the code, but it also deploys the system. It can report on all of the operations as well. A perfect time to run reports on the quality of the source code is each time the code checks into source control.
PyTest Reporting #
At the most fundamental level running a test and generating a report are directly linked. If a check fails, a rational person wants to know why? This is where reporting comes into play. Let’s take a look at a repo called myrepo which is located at https://github.com/noahgift/myrepo. To generate a pytest report, I run python -m pytest tests/*.py.
(.myrepo) ➜  myrepo git:(master) python -m pytest tests/*.py
============================= test session starts ==============================
platform darwin -- Python 3.7.6, pytest-5.3.3, py-1.8.1, pluggy-0.13.1
rootdir: /Users/noahgift/src/myrepo
plugins: cov-2.8.1, nbval-0.9.4
collected 1 item

tests/test_myrepo.py .                                                   [100%]

============================== 1 passed in 0.01s ===============================
The main takeaway is that I see a simple report that shows that exactly one test has passed. If I got into the function it is testing and change the service myfunc to return 2 instead of 1, I can rerun the test and make it fail.
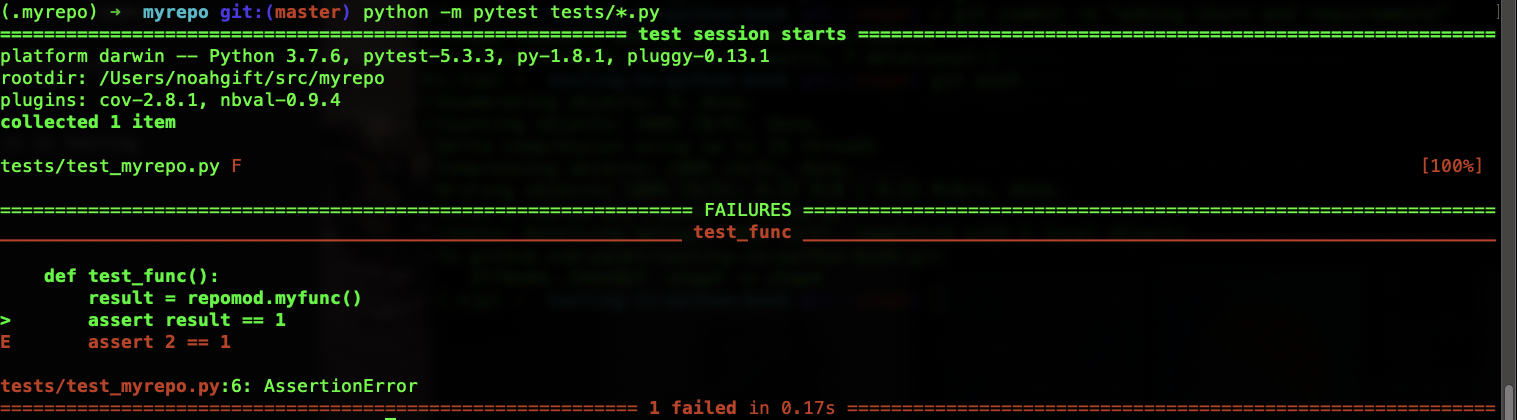
The terminal shows in red coloring the parts of the test that have failed.
Verbose output #
In the last example, a failed test generated a default report. There is a way to get more detail both with successful and unsuccessful trials, though. This step can come in handy when there is a particular failure test you want to drill into, or if you’re going to ensure a specific new piece of code has a test associated with it.
The way to get more verbose output is to use the --v or --vv flag. Each extra v adds a bit more output. Here is the same failed test run with verbose output: python -m pytest -vv tests/*.py
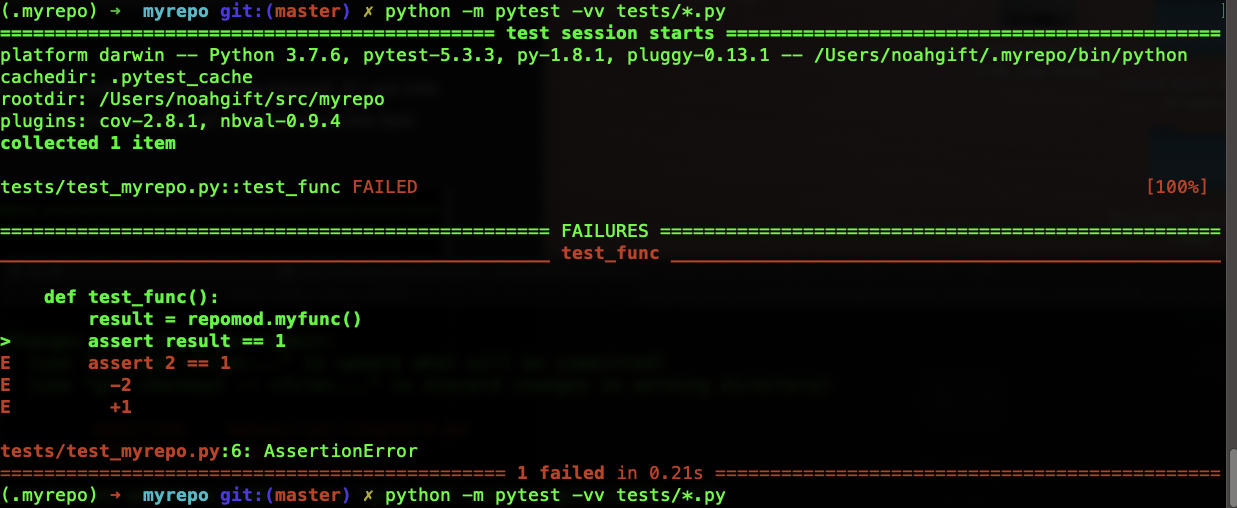
The general idea here is then in some situations, it may make sense to have very verbose test output for reporting, and in others, it is distracting. The build server could generate verbose output then via the --vv option, but locally a developer would default to normal verbosity.
PyTest Coverage Reports #
Some things just go together like peanut butter and chocolate or milk and cookies. The pytest framework and the coverage module are two such items. If you are doing the right thing and testing your code, why not also figure out why code is missing coverage? It may be the case that you are ok with parts of your system missing tests, but at least you know.
To get started with code coverage, you install the pytest-cov module and then run it as a plugin. Here is an example output python -m pytest --cov=myrepolib tests/*.py using the same myrepo project.
(.myrepo) ➜  myrepo git:(master) python -m pytest --cov=myrepolib tests/*.py
============================= test session starts ==============================
platform darwin -- Python 3.7.6, pytest-5.3.3, py-1.8.1, pluggy-0.13.1
rootdir: /Users/noahgift/src/myrepo
plugins: cov-2.8.1, nbval-0.9.4
collected 1 item

tests/test_myrepo.py .                                                   [100%]

---------- coverage: platform darwin, Python 3.7.6-final-0 -----------
Name                    Stmts   Miss  Cover
-------------------------------------------
myrepolib/__init__.py       1      0   100%
myrepolib/repomod.py       11      4    64%
-------------------------------------------
TOTAL                      12      4    67%


============================== 1 passed in 0.10s ===============================
The main takeaway is that a coverage report gives a user another signal to look at in making decisions about software.
PyTest with Jenkins and JUnit #
If pytest and coverage are like peanut butter and chocolate, then perhaps Jenkins, JUnit reporting, and pytest are like peanut butter and jelly sandwich. I still remember how, from the age of five to about 12 years old, I would eat a peanut butter and jelly sandwich every day for lunch. It was classic and performed the task I needed it to complete.
Similarly, the Jenkins workflow that includes testing for Python should also include reporting like integrates with the build.
Code Quality #
I have always been interested in metadata about software; perhaps that why I also teach machine learning and data science at Duke, UC Berkeley, Northwestern, and other universities. In Data Science, one of the most challenging problems is to find the data. With source control, the metadata creates for us. It is fascinating to look at source code and dig into what signals it can send. Let’s talk about some of the signs that source control can send out by referring to a project I wrote called devml.
You can install devml with pip: pip install devml. It will then be made available via a command-line utility called dml.
(.tip) ➜  testing-in-python-book git:(chap4) ✗ dml
No project directory with config.json:  project/config.json

Usage: dml [OPTIONS] COMMAND [ARGS]...

  Github Machine Learning Tool

Options:
  --version  Show the version and exit.
  --help     Show this message and exit.

Commands:
  csv     CSV Operations
  github  Downloads Repositories From Github
  gstats  Generate Stats
To use this tool, you will need to create a project/config.json that contains the following structure that contains org, checkout_dir, and oath. The oath value from Github works by referring to this article.
(.tip) ➜  /tmp cat project/config.json
{
    "project" :
        {
            "org":"gohugoio",
            "checkout_dir": "/tmp/checkout",
            "oath": "<keygenerated from Github>"
        }

}
Next up, I run dml github download to download all of the git repos in the Github organization. This step will download every single repository in the organization, as shown.
(.tip) ➜  /tmp dml github download
2020-01-26 16:42:01,225 - devml - INFO - Creating Checkout Root:  /tmp/checkout
2020-01-26 16:42:01,876 - devml - INFO - Found Repo # 1 REPO NAME: hugo
2020-01-26 16:42:01,876 - devml - INFO - URL: git@github.com:gohugoio/hugo.git
...
Once this completes, I can start to look at stats like activity or churn. The full list of sub-commands is below.
(.tip) ➜  /tmp dml gstats
Usage: dml gstats [OPTIONS] COMMAND [ARGS]...

  Generate Stats

Options:
  --help  Show this message and exit.

Commands:
  activity         Creates Activity Stats Example is run after checkout:...
  author           Creates Author Stats Example is run after checkout:...
  authorchurnmeta  Descriptive Meta Churn For Author Example is run after...
  churn            Finds churn by file for a repo Example is run after...
  deleted          Creates File Deletion Stats Example is run after...
  metachurn        Finds median churn metadata for a repo Example is run...
  metadata         Creates Metadata Stats and Outputs JSON Example is run...
  org              Creates Org Stats and Outputs JSON Example is run after...
The people analytics of a team #
So what do people analytics data show us about source code? Is it even necessary? There are many open areas of research that look at the behavioral characteristics of workers. A recent article in the Harvard Business Review addressed the issue of people analytics. One example they showed was a chart that monitored employee burnout and how workers that worked more than 60 hours per week are at risk of burnout. Using tools like devml we can look at similar issues.
In the gohugoio Github organization, we can have several new behavior items by using the activity flag.
(.tip) ➜  /tmp dml gstats activity
16:50:17 - devml.mkdata - INFO - Found repo: /tmp/checkout/gohugoioTheme
16:50:17 - devml.mkdata - INFO - Processing Repo: /tmp/checkout/gohugoioTheme
              author_name  active_days active_duration  active_ratio
111   Bjørn Erik Pedersen          958       1777 days          0.54
890      digitalcraftsman          321       1512 days          0.21
61            Anthony Fok          203       1896 days          0.11
245      Digitalcraftsman          169        568 days          0.30
970                 spf13          145        865 days          0.17
The developer that has committed code on most days is Bjørn Erik Pedersen, and he has been active for 1777 days or close to 7 years. In those seven years, he has committed code at an astonishing rate of every other day or 0.54. Perhaps this developer is really into their system, and it is exciting to be involved in such a successful project, and it drives him to contribute at that level. Alternatively, perhaps there is a level that could be too high, and it could cause burnout, as the HBR article alludes.
Using a tool like devml and adding into the build process could create additional metrics for a team to look at. Maybe a team member is being pushed too hard, and the organization or management can reduce their load. Likewise, perhaps a prolific developer who typically commits code every single Monday-Friday starts committing code once a week. What is going on? Maybe they have a new manager who is highly ineffective and inexperienced and pulls them into meetings too frequently, which disrupts their ability to get work done.
Churn #
There has been a lot of research about how to code churn predicts defects in software. A well-cited article Use of relative code churn measures to predict system defect density highlights how “relative churn” or the frequency a file is changed relative to its size is a predictor of defects. Let’s again use devml to get the churn for this project.
As someone who is a frequent and happy user of hugo a few things pops right up. The files with the name test in them are frequently changed. This step means at least a couple of things. Tests are commonly updated, which would appear to be a good thing, but second, the tests themselves may contain bugs. Another new item is the file commands/hugo.go. This item is the actual hugo command. It is only about 1000 lines of code but has been changed 363 times for a relative churn of .31. This file may be a hot spot in the system and a vector for bugs.
(.tip) ➜  /tmp dml gstats churn --path /tmp/checkout/hugo
2020-01-26 17:25:28,647 - devml.post_processing - INFO - Running churn cmd:
    [git log --name-only --pretty=format:] at path [/tmp/checkout/hugo]
                                     files  churn_count
1                       b'hugolib/site.go'          625
2                       b'hugolib/page.go'          456
3                      b'commands/hugo.go'          363
4                  b'hugolib/page_test.go'          189
5                  b'hugolib/site_test.go'          174
6                 b'hugolib/hugo_sites.go'          160
7                        b'snapcraft.yaml'          158
8                       b'helpers/hugo.go'          150
9                      b'docs/config.toml'          146
10            b'hugolib/shortcode_test.go'          141
11                      b'commands/new.go'          130
12                            b'README.md'          129
13                   b'commands/server.go'          126
14                      b'tpl/template.go'          123
15                 b'hugolib/shortcode.go'          122
16                b'tpl/template_funcs.go'          118
17                   b'helpers/content.go'          114
18                      b'helpers/path.go'          114
19           b'tpl/template_funcs_test.go'          113
20               b'hugolib/site_render.go'          108
21                               b'go.sum'          106
22  b'docs/content/templates/functions.md'          104
23   b'docs/content/meta/release-notes.md'          101
24                               b'go.mod'          100
25                          b'.travis.yml'           92
The takeaway here is that generated churn reports automatically can also be incredibly helpful. Why not include them in your continuous integration process and periodically review them?
Linting #
Because Python is an interpreted language, it has some disadvantages over a style that has a compiler. The dream scenario is to have the best of both worlds while writing code. The ability to use a REPL (Read-eval-print loop) is compelling. On the other hand, a compiler will optimize the system and check for syntax errors.
In Python, one of the closest approximations of this “dream” scenario is a linter. Two popular linters are flake8 and pylint. Having a linter in your testing process is a must-have. Let’s see an example of both.
Flake8 #
You can install flake8 via pip install: pip install flake8. To use it, you can point it at some source code. Here is an example of what this looks like when run.
(.myrepo) ➜  myrepo git:(master) ✗ flake8 web.py
web.py:2:4: E225 missing whitespace around operator
web.py:3:1: E402 module level import not at top of file
web.py:4:1: E402 module level import not at top of file
web.py:6:1: E402 module level import not at top of file
web.py:9:1: E302 expected 2 blank lines, found 1
web.py:13:1: E302 expected 2 blank lines, found 1
Note that it will, by default, check for code formatting issues as well as syntax bugs.
Pylint #
The pylint module has been around for quite some time. It can also install with via pip install: pip install pylint. Typically when I run it initially, I focus on warnings and error and limit the code formatting. Here is an example of how I run it in a Makefile.
lint:
    pylint --disable=R,C myrepolib cli web
Notice how by disabling the R, C flags, I can make pylint a lot easier to work with, out of the box. In practice, most projects want to fail a build for code that doesn’t execute.
I remember once coming back from a trip to audit another division of our company. The project was deeply troubled, and when I ran pylint, it found approximately 20% of the code was not executable. My boss at the time told me I was making too big of a deal of that. With about 15 years of perspective since then, I can say this was completely wrong. Of course, it is a problem if you are checking in code that couldn’t possibly run. There are zero excuses for this. This step is one of the issues a tool like pylint solves.
Code Formatting with Python Black #
Several topics can instantly start a conflict in a company that writes software. A few hot topics include ticket systems, code formatting, and what language to use. This reason is why I like the black module; it reduces choice. You run the tool on your code; it reformats it in a way that is good enough. You can also pip install it: pip install black.
This workflow summarizes how useful it can be. You run it; then, the linter shuts up.
(.myrepo) ➜  myrepo git:(master) ✗ flake8 web.py
web.py:2:4: E225 missing whitespace around operator
web.py:3:1: E402 module level import not at top of file
web.py:4:1: E402 module level import not at top of file
web.py:6:1: E402 module level import not at top of file
web.py:9:1: E302 expected 2 blank lines, found 1
web.py:13:1: E302 expected 2 blank lines, found 1
(.myrepo) ➜  myrepo git:(master) ✗ black web.py
reformatted web.py
All done!
1 file reformatted.
(.myrepo) ➜ myrepo git:(master) ✗ flake8 web.py